Categories / Monitoring systems / Geohidrology
Monitoring network of the northwestern coastal aquifer of the State of Yucatan
Principal Investigator:
Dr. Roger Pacheco
Dr. Paulo Salles
Dr. Paulo Salles
Description
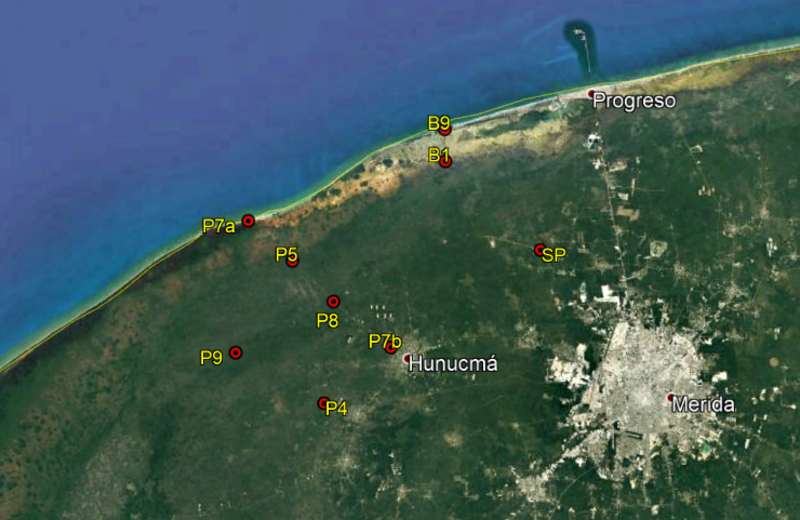
The Laboratory of Engineering and Coastal Processes (LIPC) and the National Laboratory of Coastal Resilience (LANRESC) established a monitoring network for the coastal northwestern aquifer of the State of Yucatan. The intention is to monitor aquifer heads, and the position and evolution of the saline interface. Currently, it consists of 9 wells, some of them part of the monitoring network of the National Water Commission (CONAGUA). The list of wells is:
| P4 | Nohuayun
| P5 | Sisal
| P7a | UAY Sisal
| P7b | Hunucmá
| P8 | Granja Crío
| P9 | Torre de Flujos
| SP | Sierra Papacal
| B1 | Ciénega Chuburná
| B9 | Chuburná
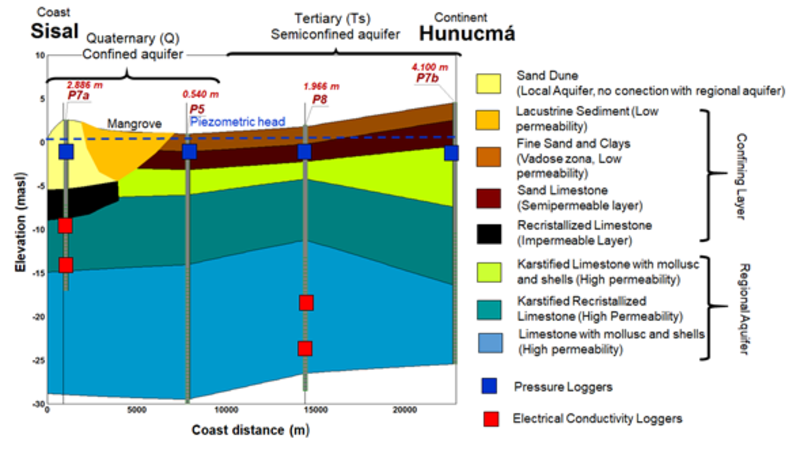
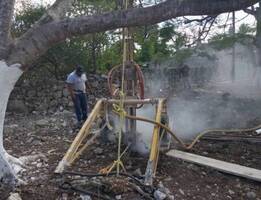
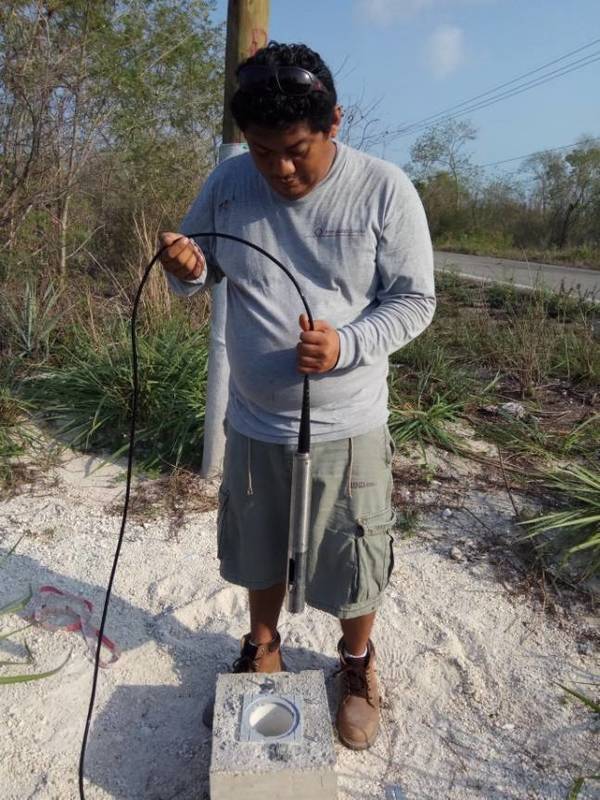
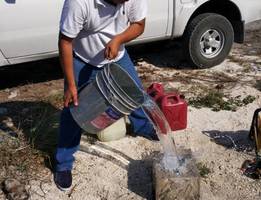
The location of those wells is shown in Fig 1. Fig 2 shows the stratigraphy between Sisal and Hunucma towns, obtained from well drilling. Figs 3, 4 and 5 show the drilling work of one of our wells, as well as one of our students realizing a salinity profile and some slug tests respectively. Each monitoring site has a pressure, temperature and electrical conductivity loggers (ONSET HoBo), sampling every 30 minutes (48 daily measurements), allowing the observation of daily and seasonal phenomena and processes affecting the aquifer and saline interface. Pressure loggers are installed 2 meters below the mean water table level and electrical conductivity loggers are installed at different depths depending on the well, and the saline interface depth.
The monitoring started in 2017, with the objective of gathering continuous water data to derive information about the functioning of the aquifer and its interaction with the sea. From our data, we have published one work where we analyze the behavior of the saline interface to tides, for example (Canul-Macario 2020).
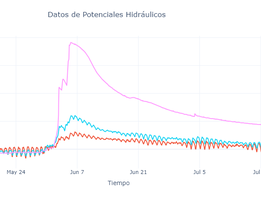
One example of our measurements is shown in Fig 6. This figure shows the effects in the aquifer caused by the precipitation caused by the storm Cristobal. We can see, the aquifer responds in different locations. If you want to visualize those and other data. Follow the link below.
https://filedn.com/lvynRc1IcGgVl9iPpJ80vS7/heads.html
https://filedn.com/lvynRc1IcGgVl9iPpJ80vS7/heads.html
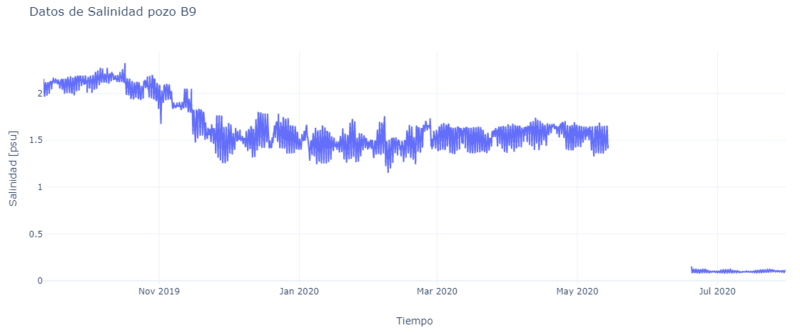
Also, Fig 7 show the variation of salinity in a sensor installed 2 meters bellow the well head. If you wat to check out the behavior of the saline interface, in the following links you could access our interactive plots. The numbers in the brackets are the depth of each sensor.
B1 [B1_S: 1.5 m, B1_I: 6.5 m]
B9 [2 m]
P7A [P7A_S: 10 m, P7A_M: 11 m, P7S_F: 12 m]
We also perform monthly salinity profiles on some of our monitoring wells. If you are interested in this data, please check the following plots.
B1
https://filedn.com/lvynRc1IcGgVl9iPpJ80vS7/profiles_B1.html
B9
https://filedn.com/lvynRc1IcGgVl9iPpJ80vS7/profiles_B9.html
P5
https://filedn.com/lvynRc1IcGgVl9iPpJ80vS7/profiles_P5.html
P7A
https://filedn.com/lvynRc1IcGgVl9iPpJ80vS7/profiles_P7A.html
All this data will be used to obtain better and more realistic models and predictions for the behavior of the aquifer. If you require more information, please do not hesitate in contacting us.
Publications and conference proceedings:
- Canul-Macario, C., Salles, P., Hernández-Espriú, A., Pacheco-Castro, R. (2020). Empirical relationships of groundwater head–salinity response to variations of sea level and vertical recharge in coastal confined karst aquifers. Hydrogeol J 28, 1679–1694. https://doi.org/10.1007/s10040-020-02151-9
- Medina J. (2020). Caracterización geohidrológica del acuífero de la Duna costera de Sisal, Yucatán. Universidad Autónoma de Yucatán. Thesis B. Eng.
- Pacheco Castro, R., Salles, P., Canul-Macario, C., Paladio-Hernández, A. (Submitted). An open water mechanism of seawater intrusion in the northern Yucatan aquifer. Hydrogeology Journal.
- Pacheco Castro, R., Salles, P., Canul-Macario, C., Paladio-Hernández, A. (2018). Flow reversal in the coastal lagoon “La Carbonera” AGU Fall Meeting 2018.
- Canul-Macario, C., Salles, P., Hernández-Espriu, J. A., & Gonzalez-Herrera, R. (2018). Simulación numérica de flujo y transporte de solutos de la porción noroeste del acuífero cárstico península de Yucatán. In U. Nacional & Salta (Eds.), El Agua Subterránea: Recurso sin Fronteras: Química, Calidad y Contaminación del Agua. Volumen I. (First edit, pp. 53–60). Salta, Argentina.
Acknowledgements:
Catedras CONACYT, project 1146 Observatorio costero para estudios de resiliencia al cambio climático.
Catedras CONACYT, project 1146 Observatorio costero para estudios de resiliencia al cambio climático.
